
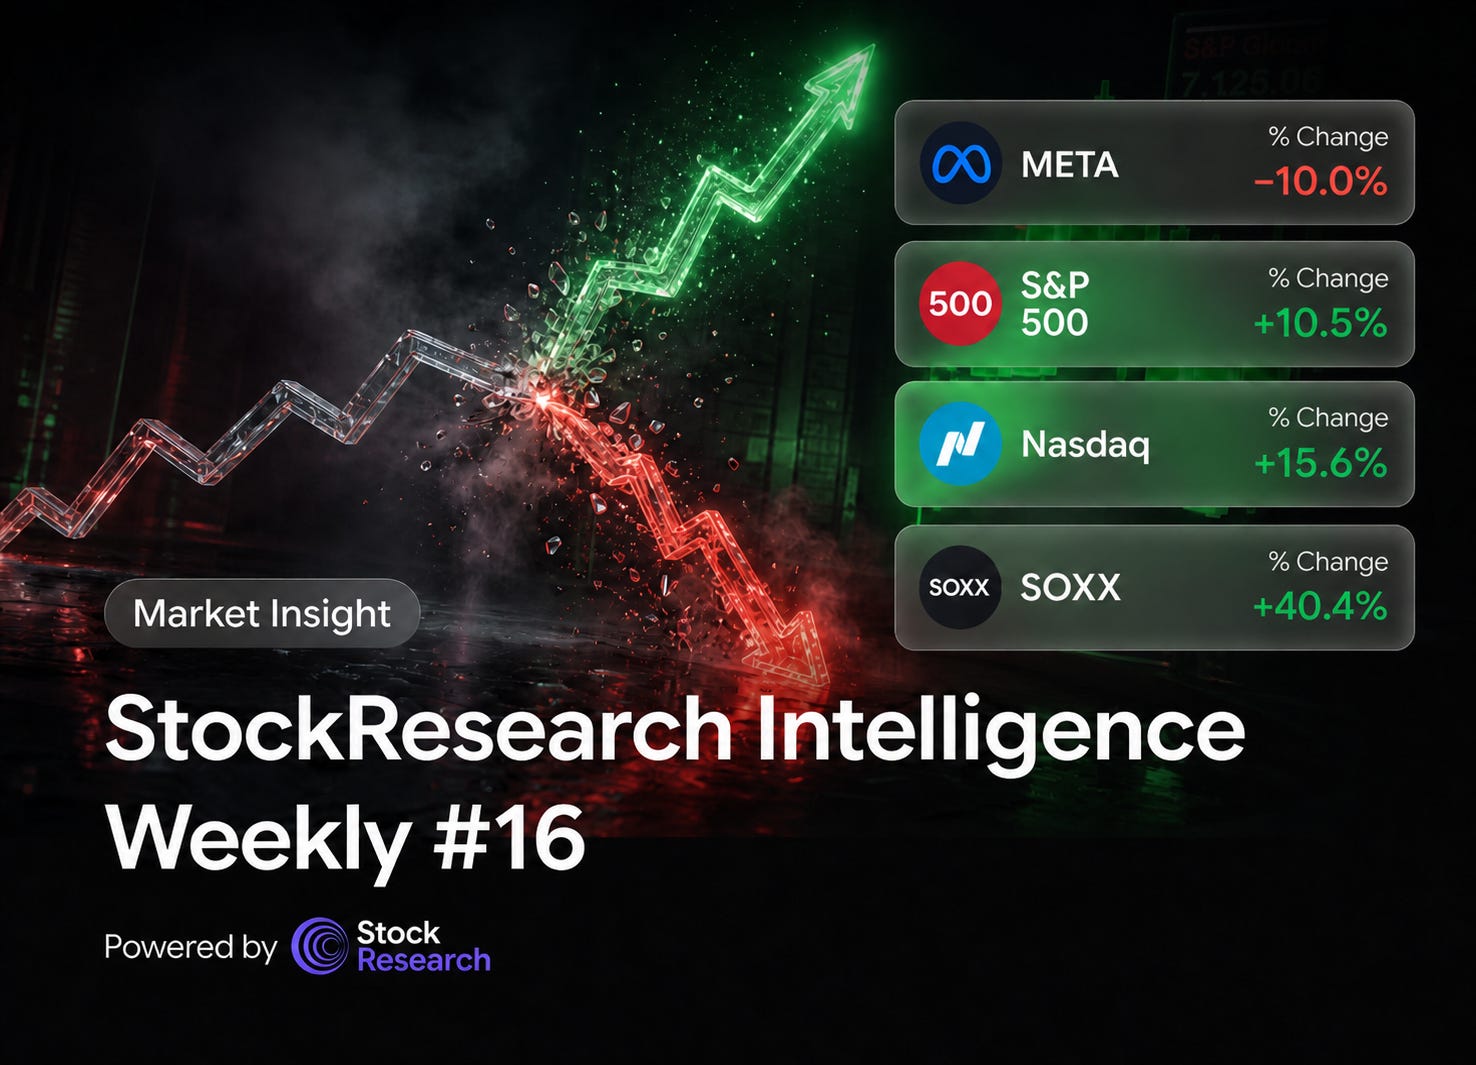
StockResearch Intelligence Weekly #16
After the Verdict, Before the Vacuum: Mag 7 Earnings Split, Most-Dissent Fed Since 1992, and the Six Weeks Until Warsh | Week Ending May 1, 2026

1. Beneath the Verdict: Best Month Since 2020 Closes on a Split Decision
The S&P 500 closed at a fresh all-time high. The Nasdaq took out 25,000 for the first time. The Russell 2000 came within a percent of its own record. Every major index posted its strongest April since 2020 — the broad market gained more than 10% on the month. On the surface, the bulls won the cleanest argument they’ve had in two years.
Underneath, three forces drove the tape and they did not align. The Mag 7 cluster split cleanly in half — Alphabet ripped roughly 10% on a Cloud line that grew 63%, Apple firmed on a beat-and-raise, while Meta tumbled roughly 10% on a $10B capex hike and Microsoft eased 3-4% on similar capex absorption concerns. The market is no longer treating Mag 7 as a monolithic bet. The Fed delivered its most divided rate decision since 1992 — 8-4, with Stephen Miran dissenting for a cut and three regional presidents (Hammack, Kashkari, Logan) dissenting against the easing bias. Powell confirmed it was his last meeting as chair but stays on as a governor. And the Iran picture began to crack — Tehran sent a fresh proposal through Pakistani mediators on Friday, pulling Brent off Thursday’s $126 wartime intraday high. Crude still fell.
Key themes this week:
AI capex was re-rated higher, not lower. All four hyperscaler prints raised the 2026 spend bar — Meta to $125–145B, Amazon to roughly $200B, Microsoft and Alphabet each to roughly $190B. The collective number sits near $670B; UBS now models $770B by year-end. The constraint isn’t demand — it’s memory pricing and physical power.
The most-dissent Fed since 1992 keeps the easing bias alive — but barely. Three regional presidents wanted that bias removed. Markets read the dissent as hawkish on net; the 10-year held above 4.39%. Warsh inherits an oil-driven inflation problem and a labor market that just printed jobless claims at a 1969 low.
Energy lagged the entire month despite oil at $108. XLE finished April negative even with Brent printing a wartime high midweek. Either oil mean-reverts on a real Iran deal — and the energy long is wrong — or oil holds and the equity market is mispricing the persistence. We lean against pressing the long here.
Healthcare is the cleanest non-tech long. Eli Lilly raised full-year revenue guidance by $2B on a 56% Q1 print. XLV was down in April. The cohort is the obvious place to redeploy if Mag 7 concentration corrects.
2. Strengths: Capex Up, Profits Up, Healthcare Resilience
Hyperscaler capex pointed up across the board, and the chip leg was the immediate beneficiary. Every one of the four reporting hyperscalers raised 2026 capex guidance against already-aggressive baselines. Microsoft now guides toward roughly $190B in 2026 spend, Alphabet to roughly $190B, Amazon near $200B, and Meta to a $125–145B range that drew a JPMorgan downgrade to Neutral. The aggregate number is the binding evidence behind the chip ETF posting its best month in its 25-year history. Honest caveat: the capex/operating-cash-flow ratios at Meta and Microsoft are now visibly stretched, and the market’s tolerance for “trust us, the demand is real” is finite. The April action says investors are still extending it. The June meeting may say something different.
Q1 earnings are running well ahead of where they started. With roughly two-thirds of the S&P 500 reported, FactSet’s blended Q1 earnings growth rate has climbed to 27.8% year-over-year — the strongest print since Q4 2021 and 11.7 percentage points above where the same estimate sat a week earlier. The earnings beat rate is 84%, the highest figure since Q2 2021. Apple delivered a clean iPhone print with revenue per geographic segment up across every region. Eli Lilly grew revenue 56% and raised full-year guide by $2 billion. Caterpillar ripped on a tariff-and-tax tailwind that read across the entire industrial complex. Honest caveat: forward 12-month P/E now sits at 20.9x, above both the 5-year and 10-year averages, leaving the multiple sensitive to any GDP or earnings revision.
Healthcare delivered the cleanest divergent print in the market. Eli Lilly’s Q1 was the kind of result that makes the “concentration risk” thesis actually actionable — adjusted EPS rose 156%, revenue grew 56%, and management raised full-year revenue guidance to a midpoint representing 28% growth versus 2025. Foundayo, the FDA-approved oral GLP-1, launched in Q2 and reportedly saw more than 20,000 patients started in the first weeks. With XLV down in April and the rest of the healthcare cohort still digesting tariff and pricing-policy uncertainty, Lilly is functioning as a one-stock barometer for what works when the AI trade pauses for breath. Honest caveat: Lilly’s forward P/E now sits in the high-20s on FY26 EPS — not cheap, just better-priced than the AI complex.
3. Weaknesses: Software Bifurcation, Energy Disconnect, Most-Dissent Fed
The Mag 7 cohort split, and the software side is now the weak link of the tape. Microsoft fell roughly 3-4% post-print despite Azure printing close to 40% growth, and Meta tumbled about 10% as the capex hike triggered a JPMorgan downgrade to Neutral, wiping roughly $175 billion off the company’s market cap in a single session. The IGV software ETF — which had a brief comeback rally earlier in April — finished the month with a return below 5% and is still down more than 20% on the year. The market is now openly pricing AI-tool disruption into a wider set of SaaS names. Salesforce, ServiceNow, and Workday all need to deliver on their next prints to defend the cohort multiple, and the burden of proof is no longer “show us the AI integration” — it’s “show us subscription net-new growth that survives the Copilot displacement curve.”
Energy stocks lagged the entire month even as oil hit a wartime high. Brent traded above $111 most of last week and printed a $126 intraday high on Thursday before easing on Iran’s Pakistani-mediated proposal. Yet XLE was negative in April. ExxonMobil’s Q1 earnings were dented by Middle East disruptions; Chevron beat but logged its lowest profit quarter in five years. The disconnect tells you the equity market does not believe Brent at $108 is sustainable — and we agree. The 60-day War Powers clock is approaching, and the path of least resistance for crude is back toward $90 if a deal materializes. Long-energy-equity is now a thesis that requires Iran and OPEC discipline and US shale restraint to simultaneously cooperate — three independent conditions, all of which have to be right.
The Fed is more divided than at any point since 1992 — and that matters into the Warsh transition. Wednesday’s 8-4 hold included one dovish dissent from Stephen Miran and three hawkish dissents from Hammack, Kashkari, and Logan opposing the easing bias. Three regional presidents in active opposition to the dovish framing of the next meeting is a meaningful shift, especially as Powell hands the gavel. Inflation isn’t cooperating: March core PCE printed 3.2% YoY (up from 3.0% in February, the highest reading in over a year), and ISM Manufacturing prices index hit 84.6, its highest since April 2022. The market’s read on a June cut is well below where it sat two weeks ago. The June 16-17 meeting becomes the next set-piece event for the equity tape — six weeks of vacuum until then.
4. Weekly Market Recap — Week Ending May 1, 2026
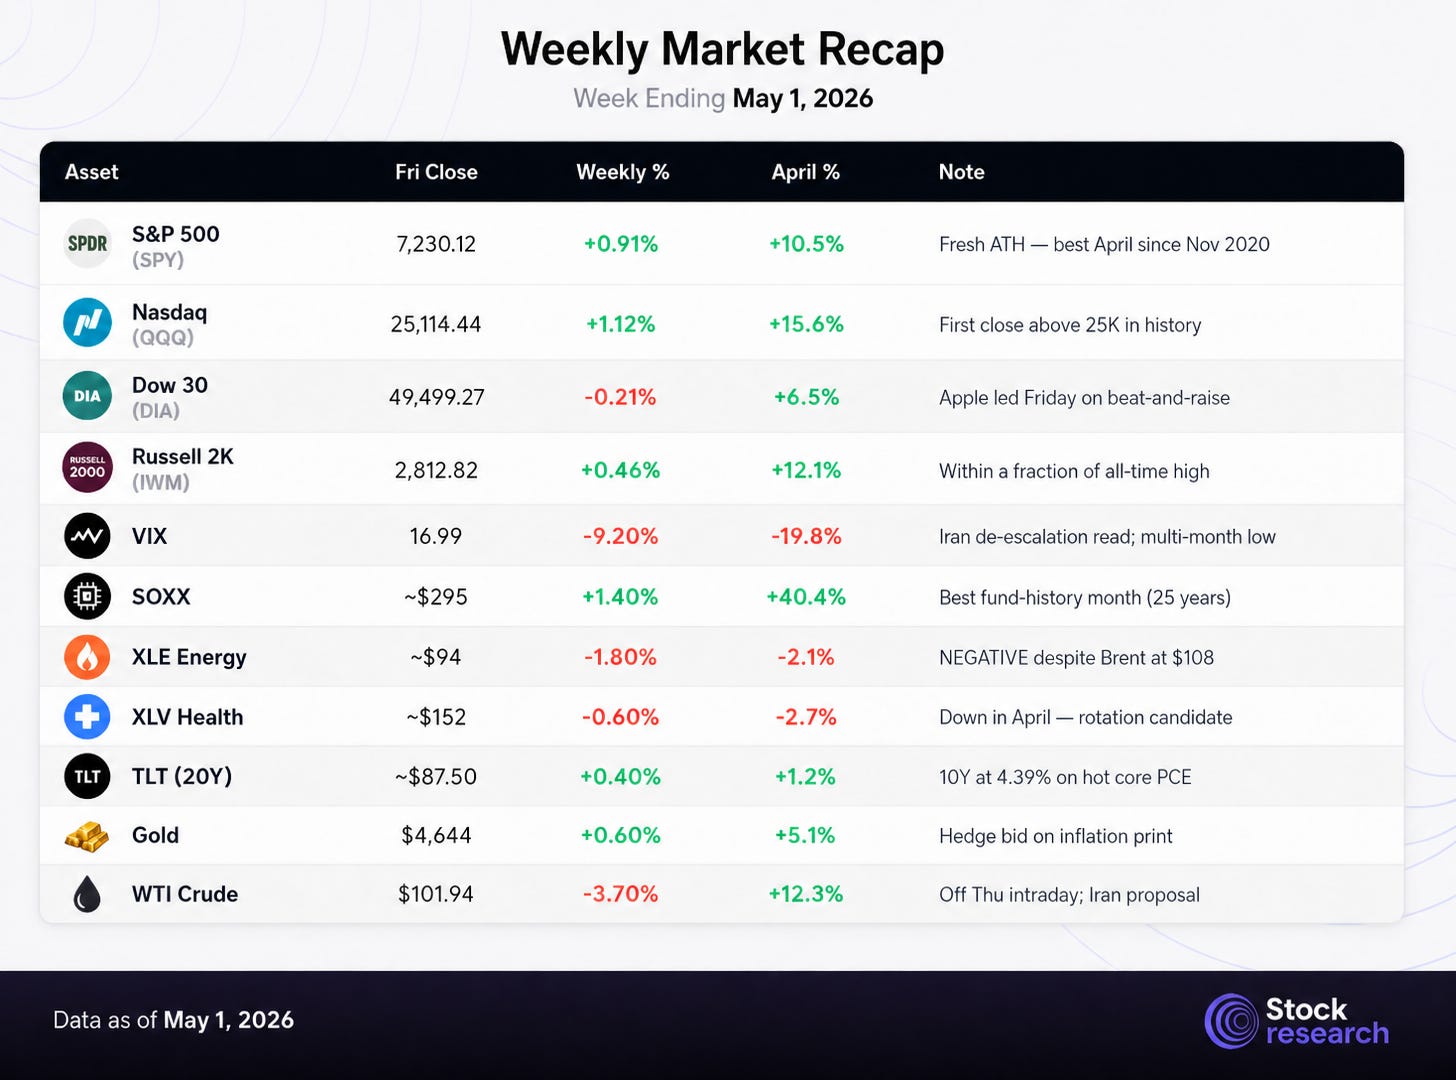
The week’s signature: fresh closing records on narrowing leadership, with cross-asset signals de-risking in step. S&P 500 and Nasdaq each printed all-time highs despite the Mag 7 split — Apple did the heavy lifting Friday with a beat-and-raise, while Russell 2000 closed within a fraction of its own record. Cross-asset, the Iran de-escalation read landed cleanly: VIX collapsed near a multi-month low, oil reversed off Thursday’s wartime high, and Treasury yields held a tight range. The cap-weighted index did nearly all of April’s heavy lifting; equal-weight underperformed by hundreds of basis points.
5. Top 3 Stock Picks for Long-Term Investment
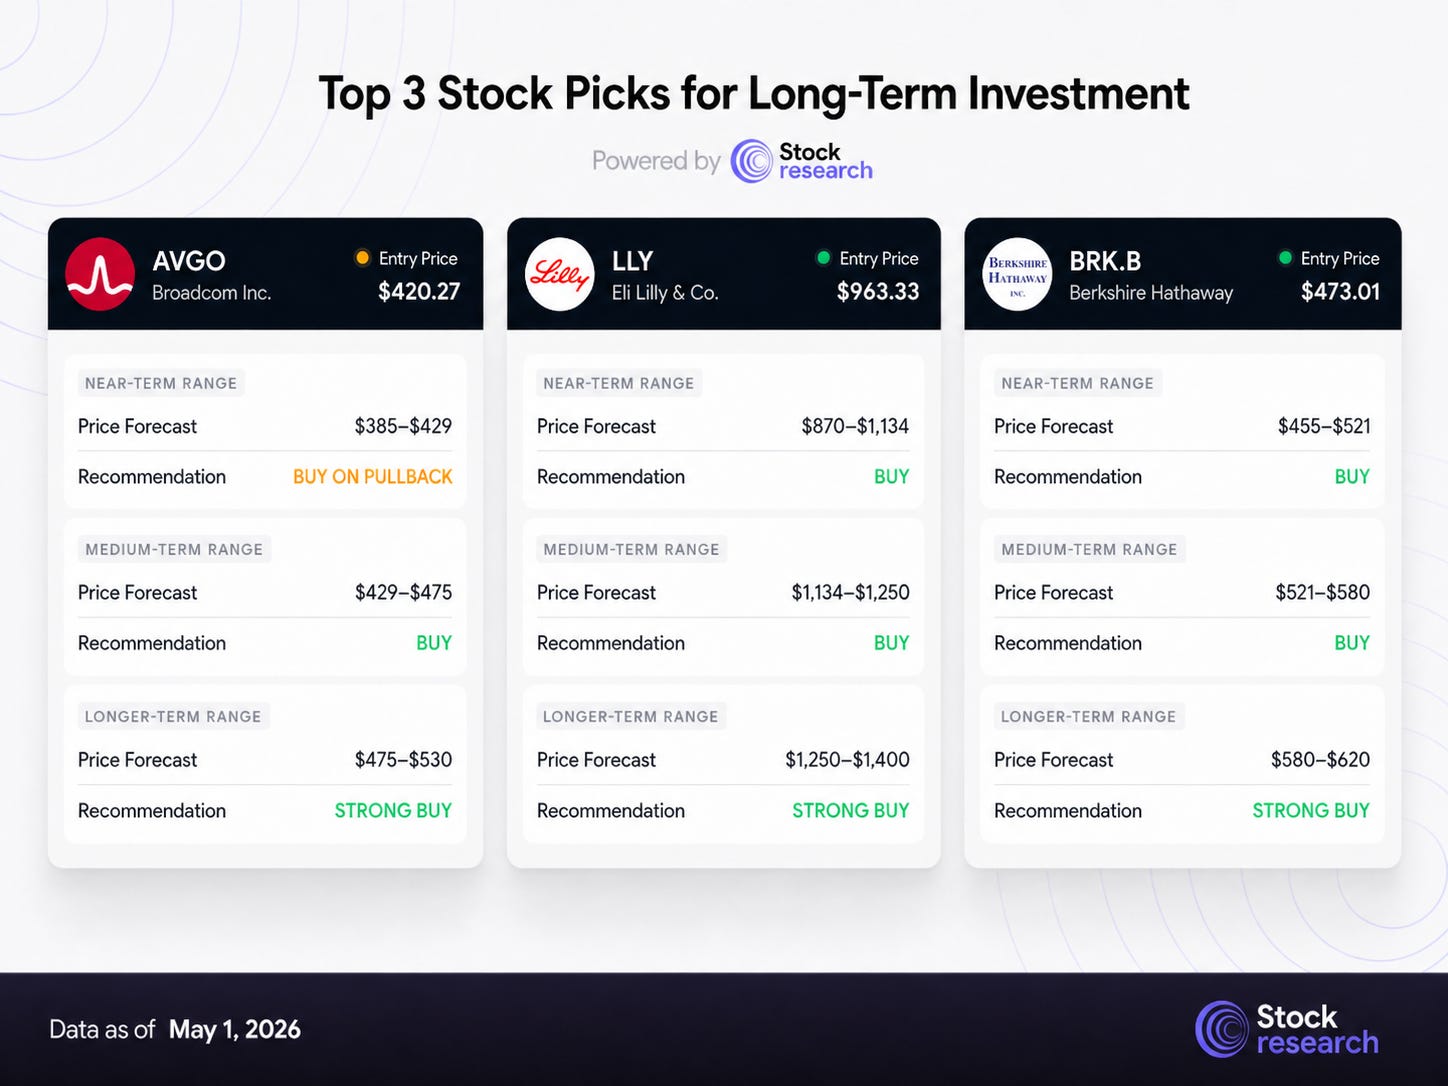
#1: Broadcom Inc. (AVGO)
Price: $420.27 | Market Cap: $1.99T | Forward P/E: ~38x | 52W Range: $195.94 – $429.31 | Earnings: June 4 AMC
Thesis: Broadcom is the cleanest direct beneficiary of every hyperscaler raising 2026 capex. The custom AI accelerator (XPU) franchise has six confirmed customers — Google, Meta, ByteDance, OpenAI, and two others — each committed to scaling toward million-chip clusters by end of 2027. Q1 FY26 AI semi revenue printed $8.4B, more than doubling year-over-year, and Q2 guidance calls for $10.7B. CEO Hock Tan has reiterated a $100B-plus AI revenue target by 2027, against a current $73B AI backlog. The Meta partnership extension on April 14 commits Broadcom to support Meta’s MTIA custom silicon at multi-gigawatt scale; the expanded Google Cloud collaboration on April 22 added another seal of validation. Broadcom is the chosen design partner for the hyperscaler-owned tooling efforts that every cloud provider is ramping to reduce Nvidia dependency.
Why now: AVGO closed Friday near $420, sitting roughly 2% below its all-time high of $429.31. The stock added more than $400 billion in market cap during April — among the largest single-month dollar gains on record for any U.S.-listed company. The Q2 FY26 print on Wednesday, June 4 is the next discrete catalyst; before that, the May 6 Cirrus Logic print and the May 20 Nvidia print drive the chip-supply-chain trade. Q2 guide-up risk is real on the June print as customer concentration shifts toward the higher-volume late-2026 ramp.
Key Levels: Support at $385 (24/7 Wall St. bear case anchor) and $345 (50-day moving average). Resistance at the $429.31 all-time high, then $443 (consensus mean target across 30 analysts), then $475–530 (bull case projection range). A weekly close above $430 on volume opens the next leg.
Risk Factors: Customer concentration (six hyperscalers drive the entire custom-silicon book); insider net selling has accelerated through the rally; the 82x trailing P/E leaves no margin for execution error if Q2 FY26 disappoints; OpenAI revenue/growth concerns reported by the WSJ on Friday could pressure the entire AI capex narrative if confirmed at June ICC events.
Verdict: BUY ON PULLBACK to the $385–405 band, HOLD at current levels. Consensus is pricing in continued AI revenue acceleration; the asymmetric setup is to add on any 5–8% pullback rather than chase a name within 2% of all-time highs. My 12-month target band: $475 base case, $530 stretch on continued AI revenue beats and a strong June 4 guide-up.
#2: Eli Lilly and Company (LLY)
Price: $963.33 | Market Cap: $910.2B | Forward P/E: ~27x | 52W Range: $623.78 – $1,133.95 | Earnings: Last reported April 30 (Q2 due late July/early August)
Thesis: Eli Lilly is the cleanest non-tech secular growth story in the S&P 500 and the highest-conviction answer to the concentration-risk question that defined April. Q1 2026 revenue grew 56% year-over-year to $19.8 billion, beating consensus by nearly 14%. Adjusted EPS of $8.55 beat estimates by 26%. Management raised full-year revenue guidance by $2 billion at each end of the range — to a midpoint of $83.5B representing 28% growth versus 2025 — and lifted adjusted EPS guidance to $35.50–37.00. The growth engine remains Mounjaro and Zepbound; the next leg is Foundayo, the once-daily GLP-1 oral pill that launched earlier this month and reportedly reached 20,000+ patients in its launch weeks. Pipeline beyond GLP-1 — Verzenio, Jaypirca, Kisunla, eloralintide — is real and accelerating.
Why now: LLY closed at $963.33 Friday, sitting roughly 15% below its 52-week high of $1,133.95. The Q1 print was the cleanest individual mega-cap result of the week; the +10% Thursday move confirmed fundamental conviction. Cantor Fitzgerald lifted its target to $1,230 on Friday; Morgan Stanley raised to $1,344. Mean consensus across 19 analysts now sits at $1,220 with a “Strong Buy” composite. Healthcare (XLV) was down in April while the S&P rose more than 10% — leaving a clean rotation candidate if AI consolidates in May.
Key Levels: Support at $935 (50-day moving average area) and $870 (200-day moving average area, mid-March pullback level). Resistance at $1,000 (psychological), $1,134 (52-week high, January top), then the $1,220–1,344 analyst target band. A weekly close above $1,000 on volume opens the path back to the highs.
Risk Factors: Pricing pressure remains real — management explicitly guided to a low-to-mid-teens price headwind for the full year. FDA proposed earlier this week to exclude tirzepatide active ingredients from compounding-eligible lists (net favorable but adds short-term policy noise). Execution risk on Foundayo manufacturing scale-up. Competitive dynamics with Novo Nordisk’s pipeline. M&A spend (Kelonia, Ajax, multiple smaller deals) increases integration risk into 2027.
Verdict: BUY. Consensus mean target $1,220 (19 analysts, +27% upside), high target $1,500. My 12-month target band: $1,250 base case, $1,400 stretch if Foundayo launch metrics keep accelerating and FY27 EPS approaches $44+. Stop discipline below $870.
#3: Berkshire Hathaway Inc. (BRK.B)
Price: $473.01 | Market Cap: $1.02T | TTM P/E: 15.2x | Forward P/E: 23.3x | 52W Range: $455.19 – $521.26 | Q1 reported May 2 ($10.18B net earnings, $11.35B operating)
Thesis: Berkshire is the largest pool of dry powder in the global equity market — and the most underappreciated long heading into a possible May concentration-risk correction. Greg Abel formally took over as CEO on January 1, and Saturday’s annual meeting in Omaha was his first as chief — Buffett seated in the audience, endorsing the succession (”doing everything I did and then some”). Q1 operating profit came in at $11.35B, up 18% year-over-year, on improved insurance underwriting after last year’s California wildfire losses. Net earnings climbed to $10.18B from $4.67B. Cash and equivalents sit above $300B. Abel ruled out any conglomerate break-up, signaled patient capital deployment, and is buying the stock himself.
Why now: Berkshire has trailed the S&P 500 by more than 30 percentage points since Buffett’s May 2025 succession announcement — extreme underperformance into what was always a transition year. With the cap-weighted S&P up more than 10% in April but equal-weight up under 6%, BRK.B sits in the bucket left behind by the AI capex trade. The setup is contrarian: low beta (0.62), no dividend pressure, $300B-plus to deploy if the market gives Abel a pullback. The first annual meeting is now behind the company; the next earnings catalyst is the Q2 print at end of July.
Key Levels: Support at $455 (52-week low set late April), then $440 (a level last seen in late 2024). Resistance at $500 (psychological), $521 (52-week high), then the $578 mean analyst price target. A weekly close above $500 on volume signals the Abel-era narrative is being absorbed positively.
Risk Factors: Apple stake remains roughly 25% of Berkshire’s equity portfolio — sympathetic exposure to the same Mag 7 dynamics the rotation is meant to hedge. Insurance underwriting cycle is favorable now but historically mean-reverts. The $300B cash pile is a strength only if Abel deploys it well; sitting on it indefinitely caps shareholder returns. The 23.3x forward P/E is not a screaming bargain, even if 15x trailing looks cheap.
Verdict: BUY. Consensus mean target ~$578 (high target $595), implying roughly 22% upside to the mean. My 12-month target band: $560–580 base case (consensus alignment), $620 stretch if Abel deploys $50B+ of the cash pile into a real correction. The cleanest defensive-with-optionality position in the megacap S&P universe. Stop below $455.
6. Low-Cap Opportunities
Three setups, three different verdicts, three discrete catalysts in the next eight trading days. All three are true low-caps under the $15B ceiling.
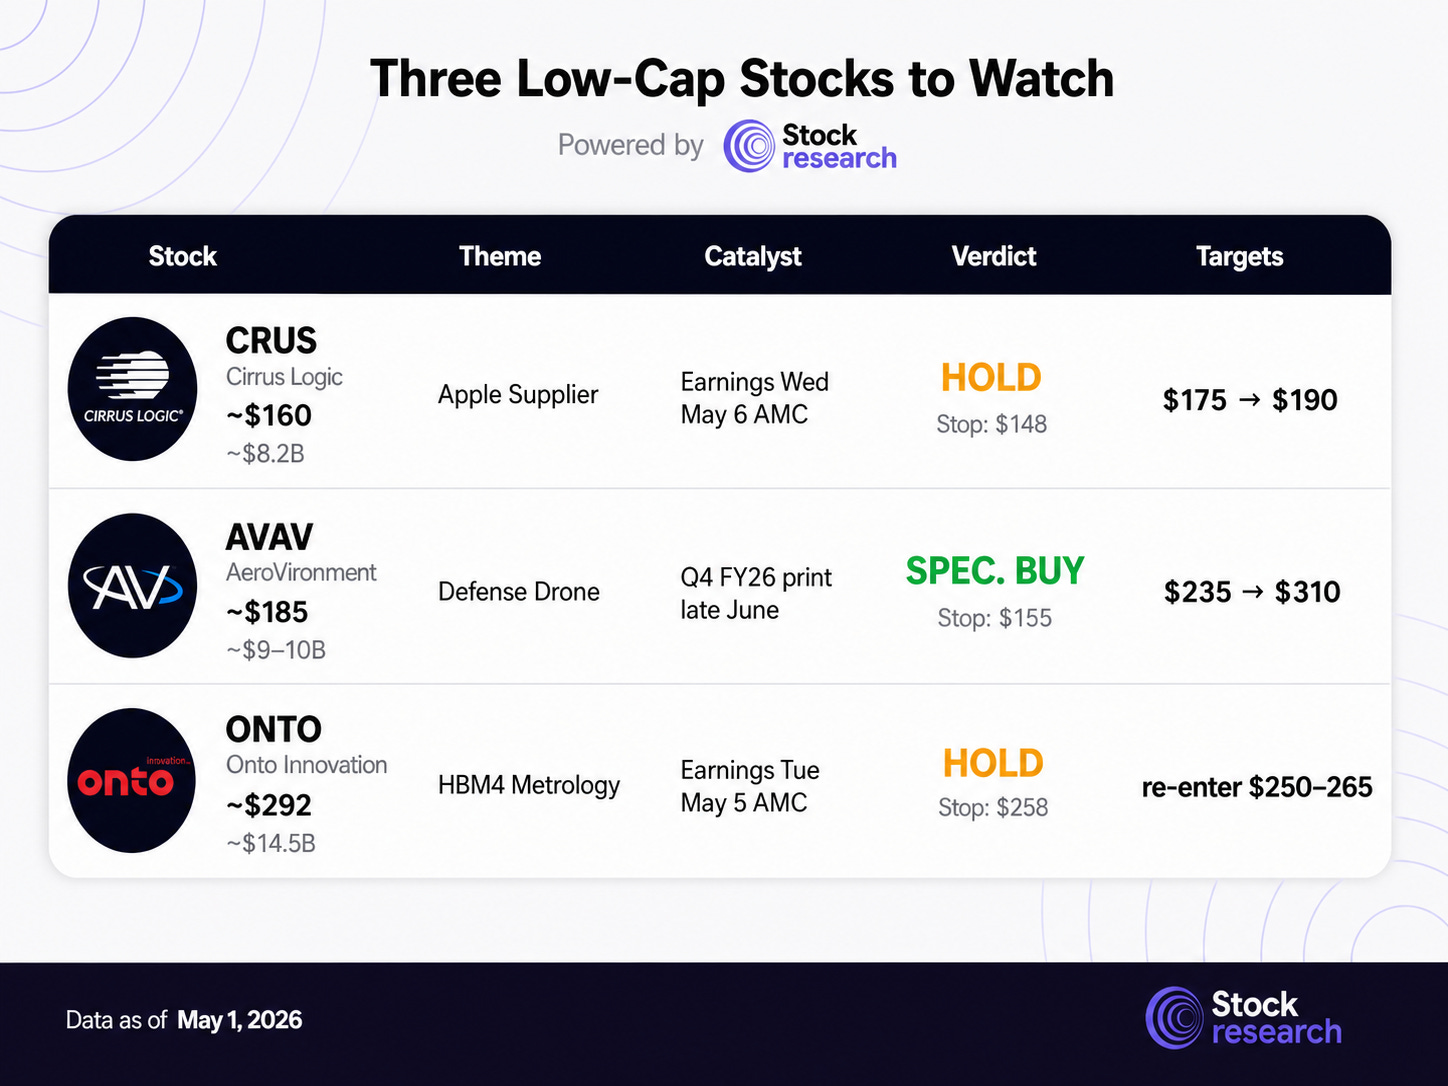
Cirrus Logic (CRUS) — Apple Supplier With Memory-Crunch Tailwind
Price: ~$160 | Market Cap: ~$8.2B | 52W Range: ~$90–$180 | Earnings: Wednesday, May 6 AMC
Cirrus Logic is the cleanest low-cap expression of Apple’s Q2 FY26 print. Apple beat on top and bottom, raised current-quarter revenue outlook, and saw iPhone revenue grow 22% YoY on the iPhone 17 cycle — Tim Cook called the lineup “the most popular in our history.” Memory pricing came up explicitly on the Apple call, and on Microsoft and Meta calls before it, as the binding capex constraint heading into late 2026. Cirrus is one of four chip and component partners (alongside Bosch, TDK, and Qnity Electronics, with GlobalFoundries as the foundry partner) added to Apple’s American Manufacturing Program in a March 26 announcement that drove a 6% same-day move and a new Face ID socket worth roughly $180M of incremental FY27 revenue per Stifel’s model. Stifel raised its target to $175 from $163 on the announcement; KeyBanc holds an Overweight at $175.
Why now: Cirrus reports Q4 FY2026 after the close on Wednesday, May 6 — three trading days after Apple’s beat-and-raise reset the iPhone supplier complex. Q1 FY27 (calendar Q2) is when iPhone build typically ramps; the guide will be the print’s main signal. The setup is post-confirmation rather than pre-event: AAPL has validated the iPhone 17 demand curve, and Cirrus’s read-through is the first concrete supplier datapoint since. The complication is consensus: StockAnalysis shows a mean target of $157 across 5 analysts — slightly below the current price. The bull-case PTs ($175) imply only 9% upside, so risk/reward is asymmetric only on a pullback.
Verdict: HOLD at current $160; SPECULATIVE BUY only on pullback to the $150–155 band with a $148 stop. My target band: $175 conservative (Stifel/KeyBanc alignment), $190 stretch only if Q4 FY26 print delivers a clean Q1 FY27 guide-up plus visible Face ID FY27 ramp commentary. Wait for the print or a pullback; do not chase at $160.
AeroVironment (AVAV) — Defense Drone, Beaten Down, Backlog Building
Price: ~$185 | Market Cap: ~$9–10B | 52W Range: $154.39 – $417.86 | Earnings: Q4 FY26 due late June
AeroVironment is the oversold contrarian setup in the section. The stock has been cut roughly in half from its 52-week high near $418 — Q3 missed, the SCAR program termination cost a large slug of revenue, and management revised down full-year guidance. But the underlying order book is intact: backlog and re-awards now sit at $4.6 billion year-to-date, the LOCUST X3 platform launched, the Switchblade family remains the battle-tested loitering munition of choice, and the BlueHalo acquisition (closed late 2025) expanded the company into space, cyber, and directed energy. With the Iran conflict ongoing and the US-China drone production gap front of mind on Capitol Hill, structural demand is unchanged.
Why now: Consensus mean target sits in the $303–317 range across major sources (StockAnalysis $317, TipRanks $303, Investing.com $311) — implying roughly 60–70% upside. Dispersion is wide ($235 low at Baird/UBS, $450 high), with 16 of 19 covering analysts at Buy. Recent action has been telling: Jefferies cut from $390 to $305, Baird from $260 to $235, UBS from $259 to $236 — all maintained Buy/Outperform ratings while resetting expectations lower. That tells you the institutional Street sees the bull case intact but is no longer pretending the path back to $400+ is clean. Q4 FY26 prints in late June, capturing the post-reset operational period. With Brent above $108 and the 60-day War Powers clock approaching, defense-tech demand persists regardless of any Iran de-escalation outcome.
Verdict: SPECULATIVE BUY at $180–195 with a $155 stop (just below the 52w low at $154.39). My target band: $235 (Baird/UBS floor, mean-reversion target), $310 base case (post-cuts consensus), $400 stretch only if Iran tail risk reasserts and the defense-tech supercycle re-rates. Smaller-than-normal position size given the Q3 miss and ongoing margin volatility; this is a higher-conviction beaten-down asymmetric trade, not a core hold.
Onto Innovation (ONTO) — HBM4 Metrology, At The Top, Print Next Tuesday
Price: ~$292 | Market Cap: ~$14.5B | 52W Range: $85.88 – $316.00 | Earnings: Tuesday, May 5 AMC
Onto Innovation is the HBM4 metrology and inspection peer to Camtek — designing and selling macro-defect inspection, optical thin-film metrology, and lithography systems used at every leading-edge logic, memory, and advanced-packaging facility. The story has improved materially in recent weeks: Onto announced a multi-year volume purchase agreement with a leading HBM customer worth more than $240 million through 2027, qualified the new Dragonfly G5 platform for 2.5D AI packaging applications, and raised Q1 2026 revenue guidance to $292 million from a prior $275–285M range. Q2 guidance was lifted above $300M, with Jefferies modeling $325M. Multiple analyst PTs were raised on the back of those updates: Jefferies to $325 (from $300, Buy), Cantor to $300 (Overweight), Stifel to $220 (Hold). Q4 2025 results in February came in slightly below estimates, but the operational reset since has been positive.
Why HOLD, not BUY: The stock has rallied from $85 to $292 — more than 240% off the lows — and now trades within about 8% of its all-time high of $316 set on April 24. The current consensus mean target is $292–295 (eToro $292.86 across 7 analysts; MarketBeat $295) — essentially at the current price. Forward P/E sits at 41x and trailing P/E above 95x. The bull case (Jefferies $325) implies only 11% upside; the bear case (Stifel Hold at $220) implies 25% downside. Q1 prints into Tuesday’s close. Buying a binary print at-or-near 52-week highs with consensus already met and a 41x multiple is poor risk/reward — even if the story is unambiguously good.
Verdict: HOLD into the May 5 print. Re-engage on either (a) post-print pullback to $250–265 if Q1 disappoints, or (b) a clean breakout above $316 on stronger-than-expected HBM4 commentary. My target band: $292–300 fair value (current consensus), $325 base case bullish (Jefferies alignment), $355 stretch on a clean Dragonfly G5 ramp. Stop on existing positions: $258. No new BUY at current levels.
7. Strategic Recap & Forward Outlook
April delivered the strongest month for the broad index since 2020, but the rally got narrower as the month progressed. The Mag 7 are no longer a single trade — they’re now two trades (winners and losers, separated by AI monetization visibility) and a wedge between them. The Fed’s most-divided meeting in 34 years tells you the easing path that drove much of the multiple expansion is harder to reach than the chart implies. The forward calendar — quiet for eight trading days, then NFP, then a Powell exit, then a Warsh transition, then a six-week vacuum — favors patience over conviction.
The trade is to hold quality positions across uncorrelated themes, define risk explicitly with stops that respect each name’s volatility, and allocate fresh capital to the cohorts the April rally left behind — healthcare, defensives, and the beaten-down low-cap names with discrete catalysts in the next two weeks. If May 8’s NFP confirms a labor market still printing claims at a 1969 low and ISM Services prints hot, the hawkish dissents become the dominant narrative and long-duration gives back. If NFP undershoots and ISM Services moderates, the easing-bias side reinforces and rotation stays orderly. Either way, the next 30 days are a rotation tape, not a beta tape. Own the names you would own anyway — and let the data do the choosing.
Forward Outlook — Week of May 4–8, 2026
This is the first week of the six-week vacuum between Powell’s exit (May 15) and Warsh’s first FOMC (June 16-17), with NFP delayed to Friday and second-derivative semiconductor names taking center stage.
Monday, May 4: Light docket. Berkshire annual-meeting commentary continues to circulate.
Tuesday, May 5: Trade balance (8:30); ISM Services PMI (10:00) — the read on whether services follows manufacturing’s prices spike; JOLTS (10:00). Onto Innovation, AMD, and Talen Energy report after the close.
Wednesday, May 6: ADP National Employment (8:15) — appetizer for Friday’s NFP. Cirrus Logic reports after the close.
Thursday, May 7: Initial Jobless Claims (8:30) — last week’s 189K was a 1969-low; durability matters. Red Cat Holdings reports after the close.
Friday, May 8: April Nonfarm Payrolls and Unemployment Rate (8:30) — delayed from May 1 due to government shutdown impact on data collection. Consensus near 67K. Michigan Consumer Sentiment Preliminary (10:00).
S&P 500 Key Levels: Support at 7,165 (last week’s low and prior all-time high), 7,100, 7,000 (psychological / 50-day MA convergence). Resistance at 7,250 (extension target from late-April breakout), 7,300 (consensus year-end strategist clusters). A clean weekly close above 7,250 signals the post-Mag-7 trend continues; a break of 7,165 on a soft NFP or hot ISM Prices opens the path back to 7,000.
Sector Outlook: Semiconductors (SOXX) carry historic April strength but at +40.4% MTD are mechanically extended; Tuesday’s AMD print is the next test. Healthcare (XLV) and Consumer Staples (XLP) lagged in April and present the cleanest rotation candidates. Energy (XLE) finished April negative despite oil at $108 — the equity market is signaling disbelief in $100-plus crude as a sustained level. Software (IGV) needs CRM, NOW, and ADBE prints to defend the cohort multiple.
Disclaimer
This analysis is for informational purposes only and should not be construed as investment advice. Equity markets carry substantial risk, including the potential loss of principal. Past performance does not guarantee future results. Price targets are based on analytical frameworks and current market data but involve significant uncertainty. Always conduct your own due diligence and consult a qualified financial advisor before making investment decisions.